In the fast-paced world of industrial processes, every data point is crucial. It helps improve efficiency, safety, and optimization. The strip chart recorder is a trusted tool for capturing and keeping this important data. It has been a key part of decision-making for decades.
This article looks into strip chart recorders. We’ll see how they work, their benefits, and the new changes making data logging and process visualization better.
Key Takeaways
- Strip chart recorders provide precise, real-time data logging for industrial processes and applications.
- These devices offer historical trend analysis and reporting capabilities, enabling data-driven decision-making.
- Strip charts offer distinct advantages over other data logging methods, such as continuous recording and analog output.
- Understanding the mechanics and components of strip chart recorders is crucial for selecting and implementing the right solution.
- Proper setup, maintenance, and troubleshooting ensure the optimal performance of strip chart recording systems.
What is a Strip Chart?
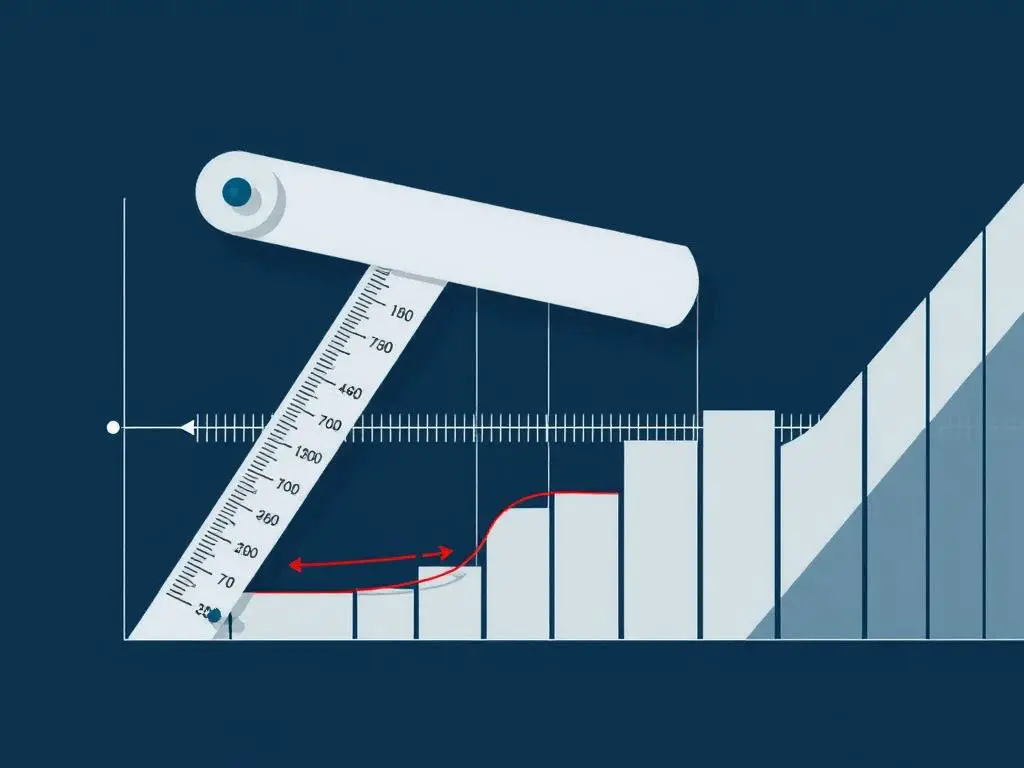
Strip charts, also known as trend recorders or chart recorders, are devices that record process variables over time. They create a visual way to see data trends. These tools are key in many fields, helping make decisions based on data.
Defining Strip Charts and Their Purpose
Strip charts are devices that record data by moving a pen on paper. They show how a process variable changes over time, like temperature or pressure. This chart makes it easy to see trends and problems.
Applications of Strip Chart Data Logging
- Process monitoring and control in manufacturing and production facilities
- Troubleshooting and diagnosis of equipment and systems
- Quality control and assurance in various industries
- Scientific research and experimentation, such as in laboratories and test facilities
- Long-term data analysis and historical trend tracking
Strip charts help users keep an eye on their systems and make smart choices. They make it simple to spot important events and understand how things work. This makes them very useful in many areas.
The Benefits of Strip Chart Recording
Strip chart recording is a powerful tool for monitoring and analyzing data. It helps with real-time monitoring and gives detailed trend reports. These insights are key for making smart decisions and improving operations in many industries.
Real-time Data Monitoring and Analysis
Strip chart recording is great for real-time data monitoring. It captures and shows important process details. This lets teams watch performance closely and spot issues fast.
With this real-time info, teams can make quick changes. This keeps processes running smoothly and efficiently.
Historical Trend Analysis and Reporting
Strip chart recorders are also top-notch for historical trend analysis and reporting. They keep detailed records that show long-term patterns and help find the root of problems. These records are key for making data-driven decisions and meeting compliance needs.
“Strip chart recording offers unparalleled insight into our manufacturing processes, allowing us to identify and address issues before they become major problems.”
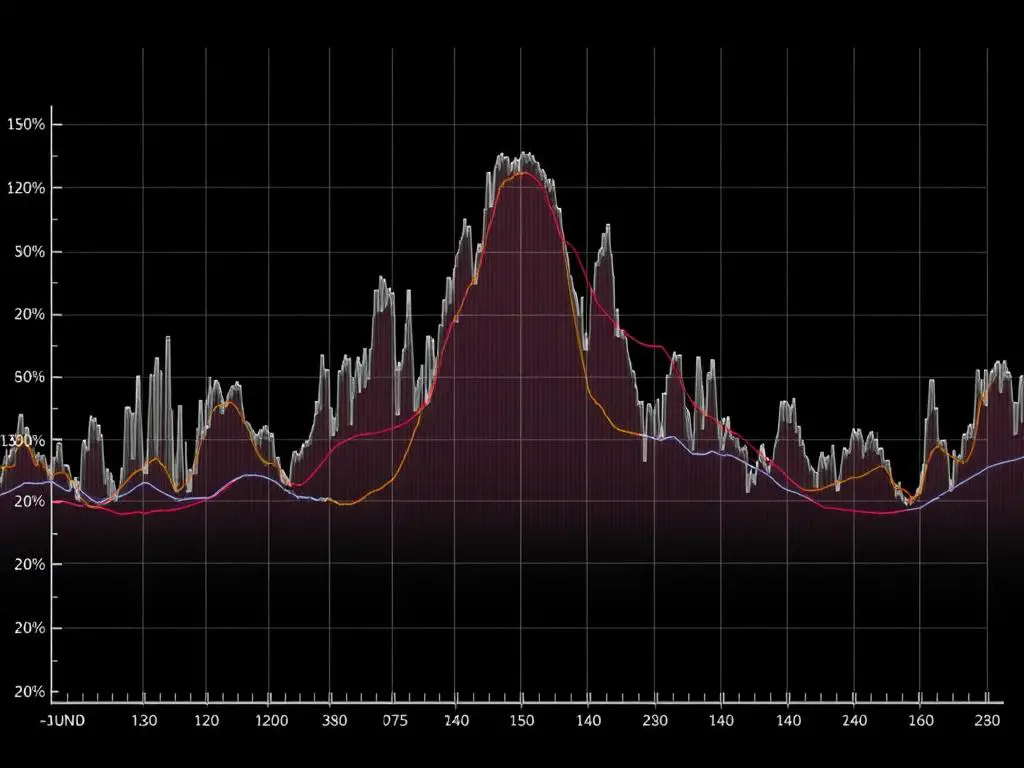
By using strip chart recording, organizations can improve their operations. They can make better products and make decisions based on solid data. If you want to boost your data reporting or understand your processes better, strip chart technology is a great choice.
Strip Chart vs. Other Data Logging Methods
There are many ways to log data, each with its own benefits. Strip chart recording is a classic method that offers unique advantages. It’s a favorite for many applications because of these benefits.
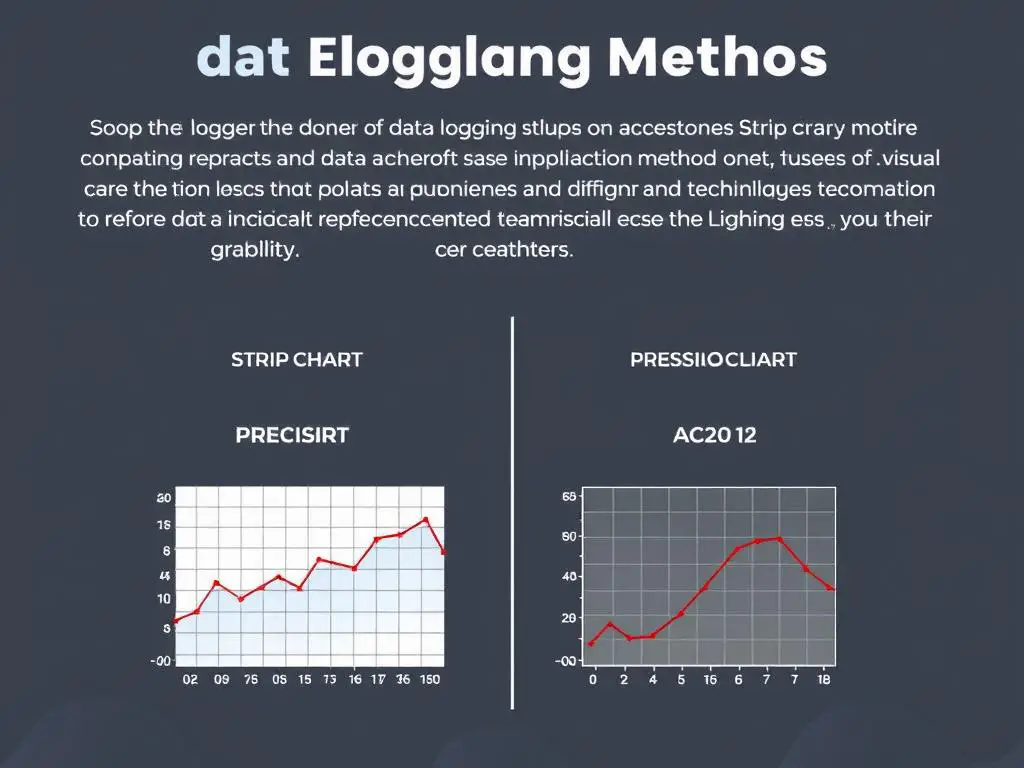
Strip charts are different from digital systems because they record data on a physical strip. This makes it easy to see trends and analyze data over time. It’s great for industries that need to monitor things in real-time and look back at historical data.
| Feature | Strip Chart Recorder | Digital Data Acquisition |
|---|---|---|
| Data Visualization | Easily interpreted physical record | Electronic data storage and display |
| Trend Analysis | Provides clear visual representation of historical data | Requires post-processing and analysis software |
| Reliability | Mechanical design with fewer failure points | Susceptible to software and hardware issues |
| Power Requirements | Can operate without external power sources | Requires constant power supply |
Digital logging has its perks, like storing and handling data easily. But strip chart recorders are great for showing data in real-time. They’re perfect for situations where you need to analyze data right away, like in manufacturing or monitoring the environment.
Choosing between strip chart recorders and other data logging methods depends on what you need. Knowing what each method offers can help you pick the best chart recorder or digital data acquisition system for your project.
How Strip Charts Work
Let’s dive into how strip chart recorders work. We’ll look at the mechanical process and the shift to digital systems. These tools have changed a lot, offering precise data logging for many industries.
The Mechanics of Strip Chart Recorders
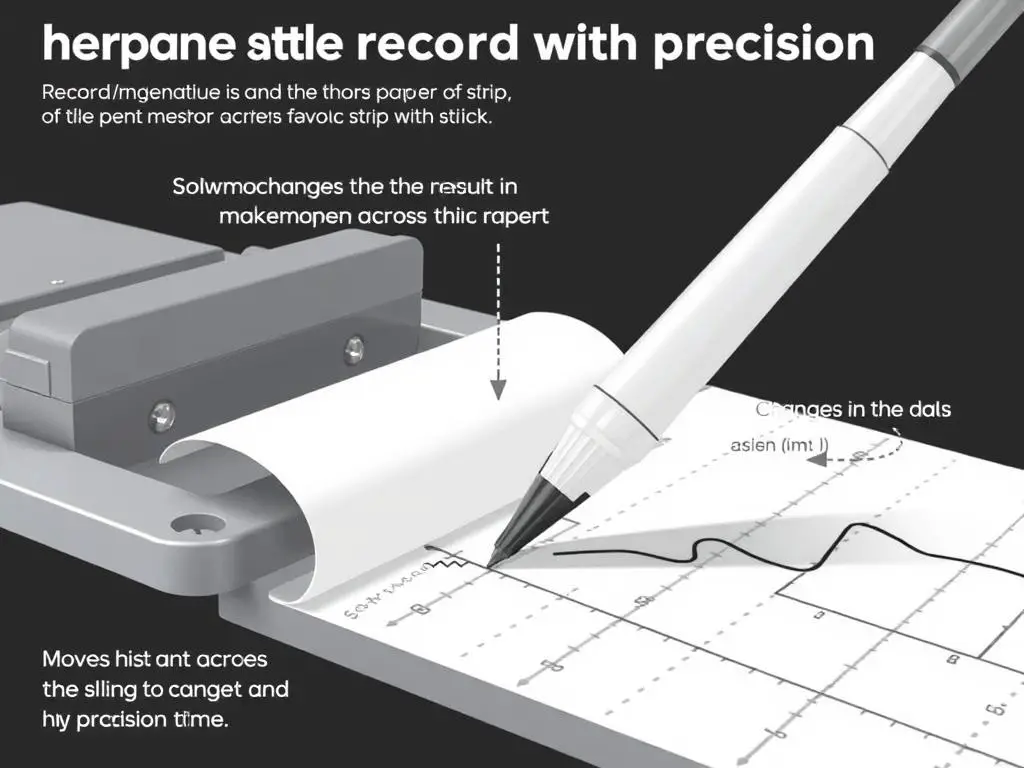
A strip chart recorder uses a mechanical system to turn analog signals into a visual format. A pen or stylus writes the data on a moving paper chart. This creates a detailed record of changes over time.
The strip chart mechanics make sure the recording is accurate and consistent. This lets users easily monitor and analyze analog recording data.
Digital Strip Chart Data Acquisition
The digital era has changed strip chart technology too. Now, digital data acquisition systems work with strip chart recorders. They offer features like high-resolution data capture and automated storage.
These systems also connect with computer software for detailed analysis and reports. This digital change has made strip chart recording more powerful for making decisions and monitoring trends.
“The strip chart recorder remains an indispensable tool for industries requiring precise, real-time data logging and historical trend analysis.”
Strip Chart Recorder Components
At the core of a strip chart recorder are key components that work together to capture industrial data with precision. These parts are vital for the system’s accurate and reliable performance in industrial data acquisition. Let’s explore the main elements that form a strip chart recorder.
Pen and Chart Paper
The pen and chart paper are the main parts that connect the strip chart recorder to the data it tracks. A high-quality ink pen traces the data’s changes on the moving chart paper. This creates a visual record of the data over time. The chart paper is made of strong, coated materials to support this recording.
Drive Mechanism
The drive mechanism moves the chart paper at a steady pace. It can be powered by a motor or clockwork. This ensures the chart paper moves consistently, capturing data accurately over time. You can adjust the chart paper’s speed to fit your application’s needs.
Sensors and Input Channels
Strip chart recorders can connect to many sensors and input channels. This lets them track data from various industrial processes. They can work with temperature sensors, pressure transducers, flow meters, and more. This ensures they can monitor and record the right parameters accurately.
Data Storage and Retrieval
Many modern strip chart recorders also have digital storage and retrieval. This digital part lets you easily move recorded data to computers for analysis and reporting. This makes the strip chart recorder even more useful in industrial data acquisition.
Understanding the main parts of a strip chart recorder shows how precise and reliable these tools are in capturing and keeping industrial data. This knowledge helps with better decision-making and improving data-driven processes.
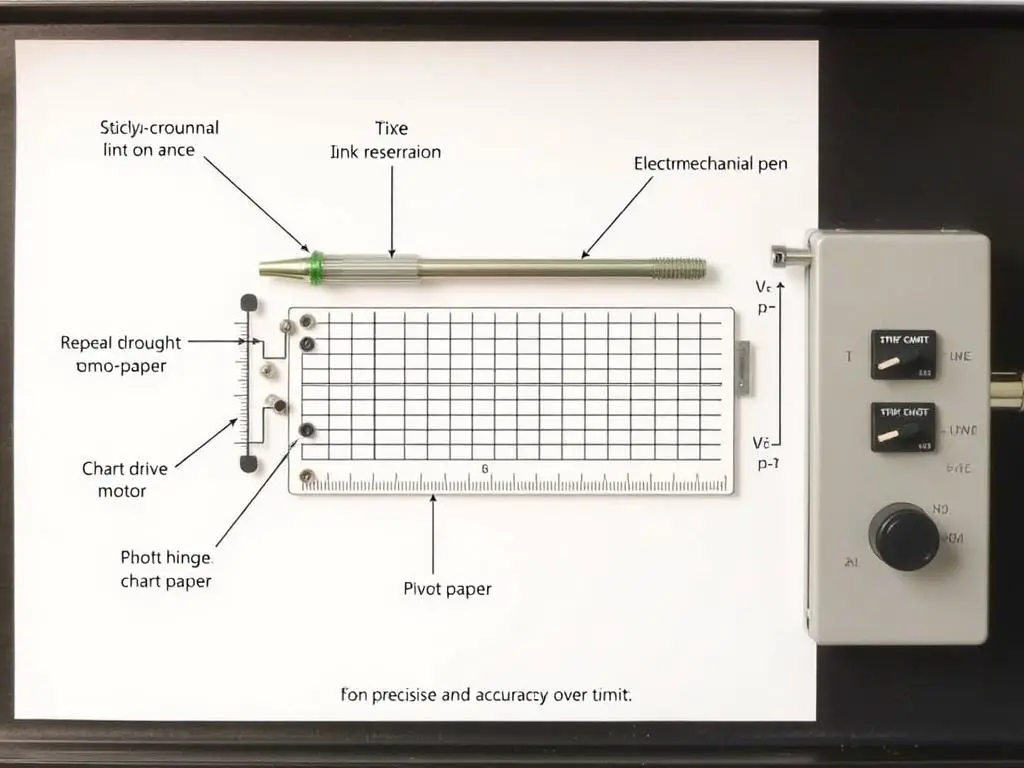
| Component | Purpose |
|---|---|
| Pen | Precisely traces the fluctuations in measured values onto the chart paper |
| Chart Paper | Provides a durable and specialized canvas for recording data |
| Drive Mechanism | Ensures the controlled and consistent movement of the chart paper |
| Sensors and Input Channels | Allows the recorder to interface with various industrial measurement devices |
| Data Storage and Retrieval | Enables the integration of digital data management capabilities |
Choosing the Right Strip Chart Recorder
Choosing the right strip chart recorder is key for industrial data and process monitoring. You need to look at several important factors to make sure it works well with your needs.
Factors to Consider for Optimal Performance
Here are the main things to think about when picking a strip chart recorder:
- Recording Range: Figure out what range you need for your industrial setup, like temperature or pressure. Make sure the recorder can handle all the values you want to track.
- Accuracy: Pick a recorder known for its accuracy. This ensures your data is precise and trustworthy. It should fit the needs of your process.
- Compatibility: Make sure the recorder works with your current data systems and fits into your control setup. This avoids problems and makes integration smooth.
- Data Logging Capabilities: Think about what the recorder can do with data, like storing history or making reports. Being able to export data is also important.
- Connectivity: Check how the recorder connects, like Ethernet or wireless. It should fit with your network and remote systems.
By looking at these factors, you can find a strip chart recorder that meets your needs. This ensures it works well for data logging and monitoring your process.
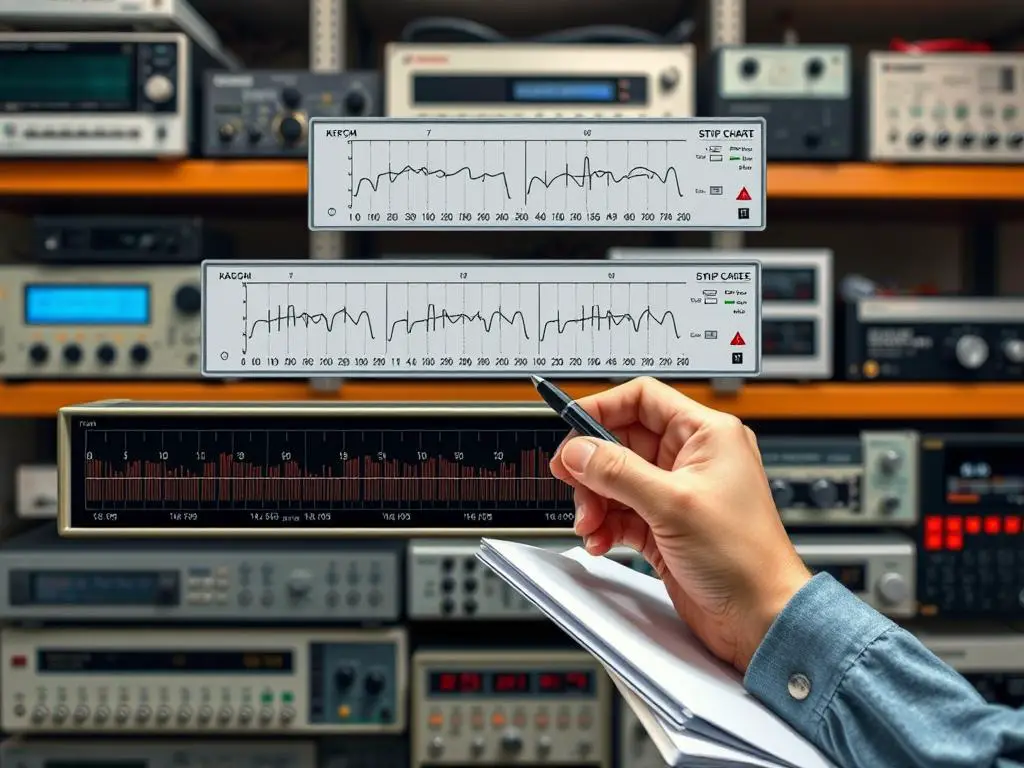
“Choosing the right strip chart recorder is essential for accurate data logging and effective process monitoring in industrial applications.”
Setting Up and Using a Strip Chart
Setting up a strip chart recorder is crucial for its smooth operation in industrial systems. It’s important to pay attention to details from the start. This ensures you get accurate data for monitoring processes.
Installation and Configuration Steps
Here are the key steps to set up a strip chart recorder:
- Mounting the Recorder: Pick a spot that’s easy to reach for checks and upkeep. Make sure it’s securely fastened to a stable spot, as per the maker’s guide.
- Connecting the Inputs: Connect the signals like temperature or pressure to the right spots on the recorder. Make sure the wiring is correct to avoid errors and get precise data.
- Configuring the Settings: Adjust the chart speed and range to fit your needs. This makes sure the recorder works best for your monitoring tasks.
- Calibrating the Inputs: Calibrate the signals well to match the actual process conditions. This is key for making accurate trends and decisions.
- Loading the Chart Paper: Put the chart paper in correctly and secure it. This gets your chart ready for logging data continuously.
By doing these steps, you can make your strip chart recorder work well. It will help you make better decisions and improve your processes.
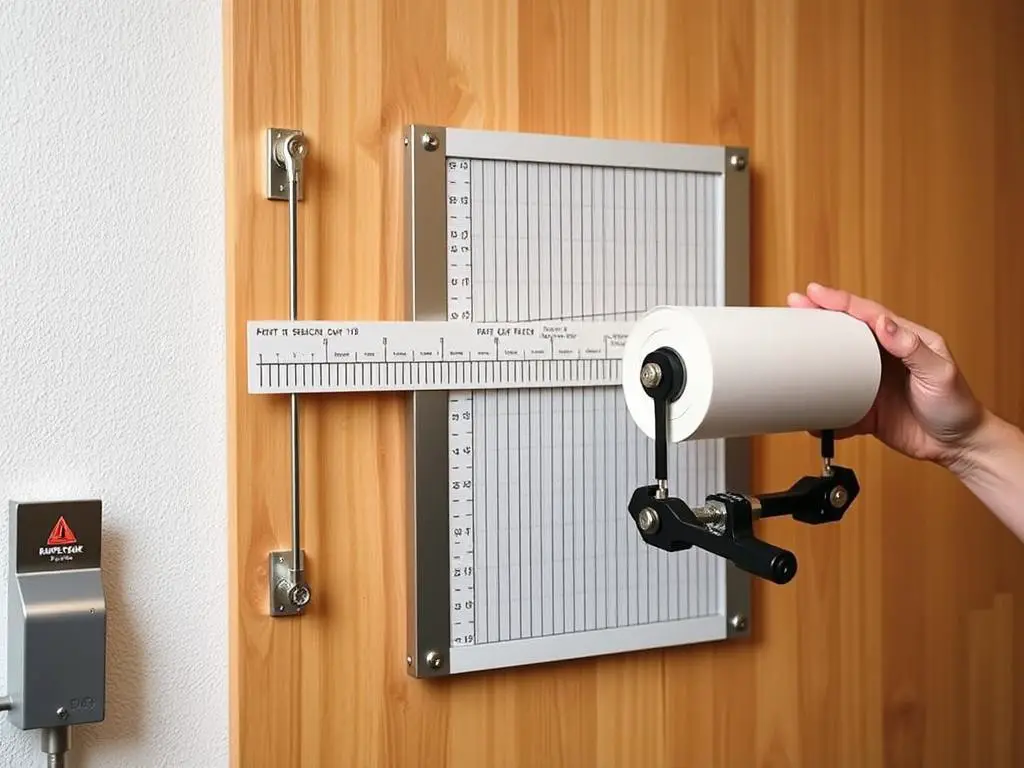
Success with your strip chart setup comes from knowing your needs well and being careful with setup. With the right setup, strip chart data can help optimize processes and boost your efficiency.
Maintaining and Troubleshooting Strip Charts
Keeping strip chart recorders in good shape is key for their reliability and long life. Regular checks and fixing common problems help your system work well. This ensures you get the accurate, real-time data you need.
Routine Maintenance for Strip Charts
Here are some tips to keep your strip chart recorder running smoothly:
- Clean the recorder’s paper feed and ink delivery system often to avoid clogs and keep it running smoothly.
- Look at the pen tips or thermal print heads for wear or damage, and replace them when needed.
- Calibrate the recorder’s input channels now and then to make sure you’re getting accurate data.
- Change the chart paper and ink/thermal ribbons as the maker suggests.
- Make sure the recorder’s power supply and electrical connections are good to avoid data logging problems.
Common Strip Chart Troubleshooting Tips
Here’s what to do if you run into problems with your strip chart recorder:
- Make sure the input signals are correctly connected and set up.
- Look for any blockages or bends in the chart paper feed.
- Check the pen tips or print heads for any clogs or issues.
- Ensure the recorder’s power supply is working right.
- Check the recorder’s firmware or software for updates or compatibility problems.
By following these tips for maintenance and troubleshooting, you can keep your strip chart recorders working great. This ensures reliable industrial data acquisition and trend analysis for your business.

| Maintenance Task | Frequency |
|---|---|
| Clean paper feed and ink delivery | Monthly |
| Inspect pen tips/print heads | Quarterly |
| Calibrate input channels | Annually |
| Replace chart paper and ink/ribbons | As needed |
| Check power supply and connections | Quarterly |
“Proper maintenance and troubleshooting are essential for ensuring the reliability and longevity of your strip chart recorders, which are critical to your industrial data acquisition needs.”
Enhancing Data Visualization
Visualizing data is key in industrial process monitoring and analysis. Strip charts are great for showing real-time data and trends. They help uncover insights and guide decisions. By designing charts well, you can make your strip chart data more impactful.
Best Practices for Clear and Effective Charting
Here are tips to make the most of your strip chart data:
- Clarity and Legibility: Make sure your charts are easy to read. Use clear labels and scales. Keep the layout simple to focus on the main info.
- Intuitive Design: Choose familiar chart types like line graphs or bar charts. This makes it easier for your audience to understand the data.
- Highlighting Key Metrics: Focus on the most important data with color or annotations. This makes it stand out.
- Contextual Framing: Add context like thresholds or benchmarks to help understand the data better. This shows patterns or changes clearly.
- Interactivity and Drill-Down: Use digital tools that let users zoom or drill into data. This gives a closer look at specific points.
Following these tips can turn your strip chart data into clear and insightful displays. This supports process monitoring and better decision-making.
| Best Practice | Description | Example |
|---|---|---|
| Clarity and Legibility | Ensure charts are easy to read with clear labels and legible axis scales. | |
| Intuitive Design | Use familiar chart types that match the data you’re showing. | |
| Highlighting Key Metrics | Use color or annotations to highlight important data. |
By following these tips, you can make your strip chart data visualization powerful for data analysis and better decisions.
Conclusion
In the world of industrial data and process control, the strip chart recorder is key. It offers real-time data, trend analysis, and helps make informed decisions. This makes it vital in many fields, from making products to monitoring the environment.
This article showed how strip chart recording helps businesses. It gives precise, reliable data that improves operations, quality, and follows rules. The recorder is easy to use and stores lots of data, making it a top tool for industrial data acquisition and process monitoring.
The strip chart recorder’s role will keep growing as industries need more precise data and trend analysis. By using this tech, companies can get better at making things, controlling quality, and planning ahead. This puts them ahead in a tough global market.
FAQ
What is a strip chart?
A strip chart is a device that records data over time. It shows data trends in a visual way. It’s used in many fields to monitor and analyze data in real-time.
What are the applications of strip chart data logging?
Strip charts are used for many things like monitoring processes, controlling quality, and tracking environmental changes. They help in understanding trends in industrial processes and equipment performance.
What are the key benefits of using a strip chart recorder?
Strip chart recorders offer real-time data monitoring and analysis. They help in understanding historical trends and reporting data. They also help in finding and fixing issues in industrial processes.
How do strip charts compare to other data logging methods?
Strip charts are different from digital systems because they record data continuously in an analog way. This is useful for quick analysis and decision-making on-site.
How do strip chart recorders work?
Strip chart recorders use a pen to write data on chart paper as it moves. This creates a visual record of data over time. Some modern systems also use digital technology for data analysis.
What are the key components of a strip chart recorder?
A strip chart recorder has a pen, chart paper, a mechanism to move the paper, and a way to connect input signals. These parts work together to record and display data trends.
How do I choose the right strip chart recorder for my needs?
When picking a strip chart recorder, think about the range it can record, its accuracy, how fast it records, and what signals it can accept. Make sure it fits your industrial needs and data requirements.
How do I set up and use a strip chart recorder?
To set up a strip chart recorder, install it, connect the signals, put in the chart paper, and set the recording options. Doing this right is key to getting accurate data.
How do I maintain and troubleshoot a strip chart recorder?
Keep your strip chart recorder running well by cleaning it, calibrating it, and replacing parts like the pen and paper. If it has problems, fix them by following the maker’s advice to keep it working well.
How can I enhance data visualization with a strip chart?
To make strip charts better, use good charting practices like scaling, labeling, and color coding. This makes the data easier to understand and helps you make better decisions about your processes.


